 Welcome to the United Nations
* Data from the 2021 triennial review
Kiribati Snapshot in PDF
LDC status
 |
Inclusion: 1986 |
Graduation: Recommended for graduation by the CDP; ECOSOC decision deferred to 2024 |
Reports and resolutions
 |
Inclusion |
| CDP reports: 1985, 1986 | |
| ECOSOC resolutions: E/RES/1984/58, E/DEC/1986/153 | |
| GA resolution: A/RES/41/186 | |
Graduation |
|
| CDP reports: 2003, 2006, 2009, 2012, 2015, 2018, 2021 | |
| ECOSOC resolutions: E/RES/2018/27, E/RES/2021/11 | |
| Impact assessment: 2009, 2015, 2018 | |
| Vulnerability profile: 2009, 2015, 2015 Note by UNSD, 2018 | |
| Country statements: 2015 CDP EGM, 2018 EGM, 2018 CDP Plenary | |
| Country presentation: 2009 CDP EGM, 2015 CDP EGM |
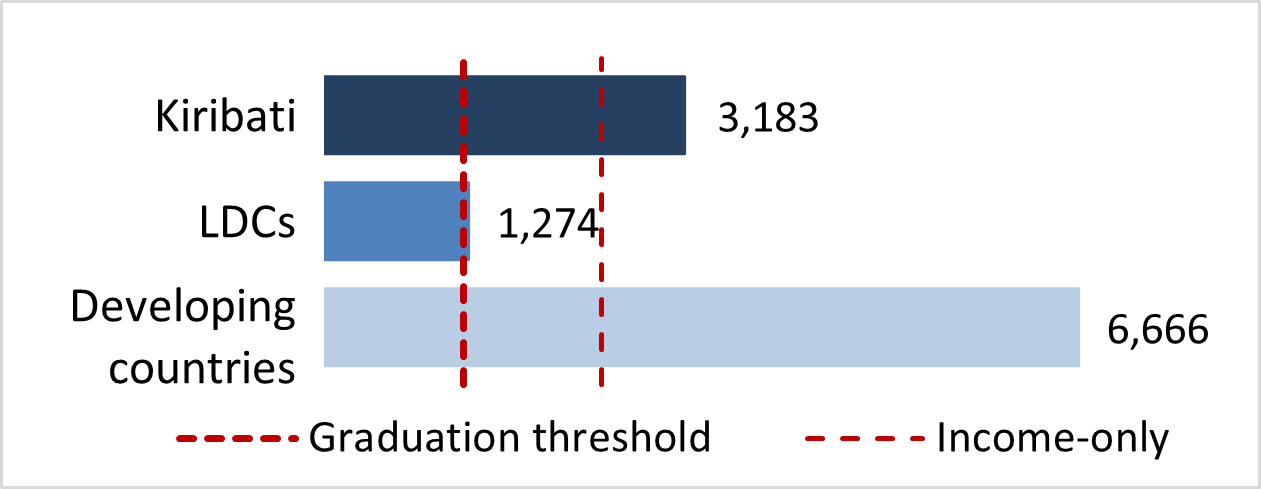
Gross national income (GNI) per capita*
|
|
Value: |
$ 3,183 |
 |
|||
Thresholds |
||||||
| Inclusion: | $ 1,018 | |||||
| Graduation: | $ 1,222 | |||||
| Income-only graduation: | $ 2,444 | |||||

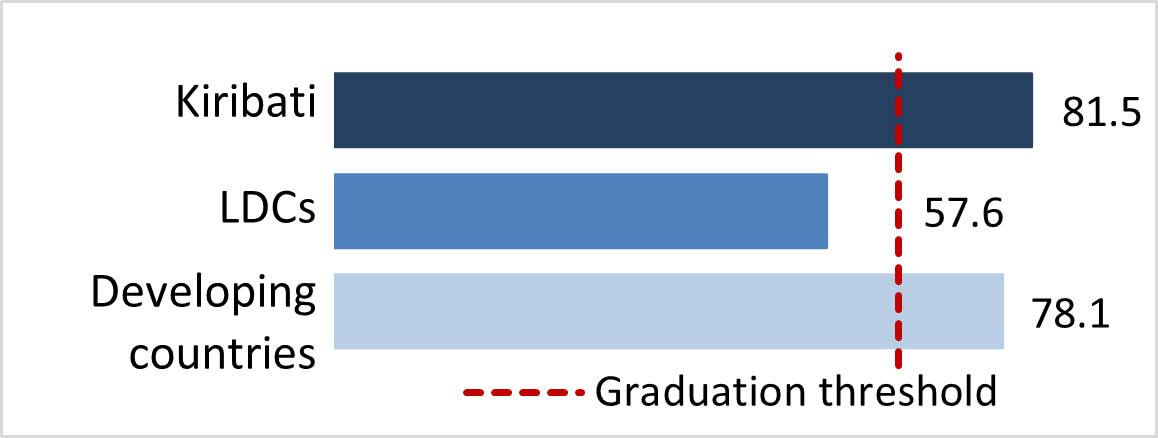
Human assets index (HAI)*
 |
Index: |
81.5 |
 |
|||
Thresholds |
||||||
| Inclusion: | 60 or below | |||||
| Graduation: | 66 or above | |||||
HAI indicators |
||||||
Under-five mortality rate |
Gross secondary school enrolment ratio |
|||||
 |
Value: | 50.9 |  |
Value: | 76.3 | |
| Index: | 75.2 | Index: | 73.7 | |||
| Source: | UN IAG for Child Mortality Estimation | Source: | Kiribati MoE | |||
Prevalence of stunting |
Adult literacy rate |
|||||
 |
Value: | 15.3 |  |
Value: | 79.6 | |
| Index: | 74.5 | Index: | 72.8 | |||
| Source: | UNICEF/WHO/World Bank Joint Child Malnutrition Estimates | Source: | Kiribati MoE | |||
Maternal Mortality Rate |
Gender parity index for gross secondary school enrolment |
|||||
 |
Value: | 92 |  |
Value: | 1.21 | |
| Index: | 92.7 | Index: | 100.0 | |||
| Source: | UN IAG for Maternal Mortality | Source: | CDP | |||
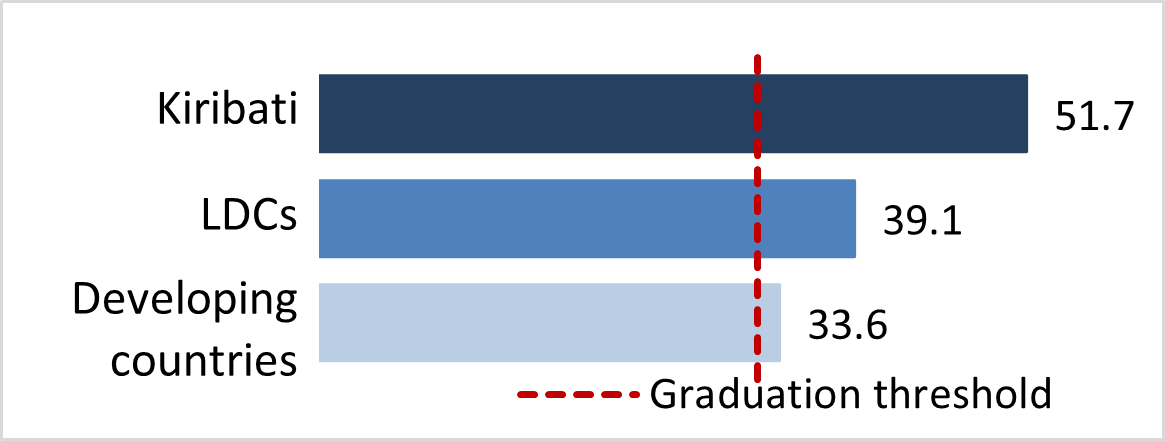
Economic and environmental vulnerability index (EVI)*
 |
Index: |
51.7 |
 |
|||
Thresholds |
||||||
| Inclusion: | 36 or above | |||||
| Graduation: | 32 or below | |||||
EVI indicators |
||||||
Share of agriculture, forestry and fishing in GDP |
Share of population in low elevated coastal zones |
|||||
 |
Value: | 27.7 |  |
Value: | 95.2 | |
| Index: | 45.2 | Index: | 100.0 | |||
| Source: | UN/DESA, Statistics Division | Source: | CIESIN | |||
Remoteness and landlockedness |
Share of population living in drylands |
|||||
 |
Value: | 76.1 |  |
Value: | 4.6 | |
| Index: | 82.7 | Index: | 4.6 | |||
| Source: | CDP | Source: | CDP | |||
Merchandise export concentration |
Instability of agricultural production |
|||||
 |
Value: | 0.83 |  |
Value: | 5.3 | |
| Index: | 85.7 | Index: | 20.3 | |||
| Source: | UNCTAD | Source: | FAO | |||
Instability of exports of goods and services |
Victims of disasters |
|||||
 |
Value: | 19.1 |  |
Value: | 0.08 | |
| Index: | 38.3 | Index: | 36.8 | |||
| Source: | UN/DESA, Statistics Division | Source: | EM-DAT | |||