 Welcome to the United Nations
* Data from the 2021 triennial review
Zambia Snapshot in PDF
LDC status
 |
Inclusion: 1991 |
Reports and resolutions
 |
Inclusion |
| CDP reports: 1987, 1988, 1991 | |
| ECOSOC resolution: E/DEC/1987/109 | |
| GA resolution: A/RES/46/206 | |
Graduation |
|
| CDP report: 2021 |
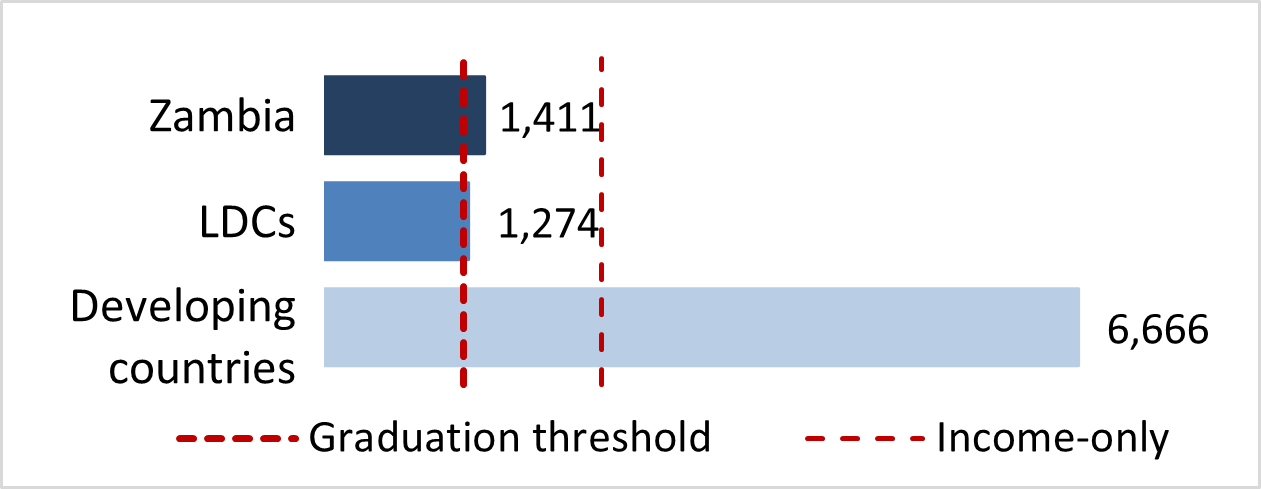
Gross national income (GNI) per capita*
|
|
Value: |
$ 1,411 |
 |
|||
Thresholds |
||||||
| Inclusion: | $ 1,018 | |||||
| Graduation: | $ 1,222 | |||||
| Income-only graduation: | $ 2,444 | |||||

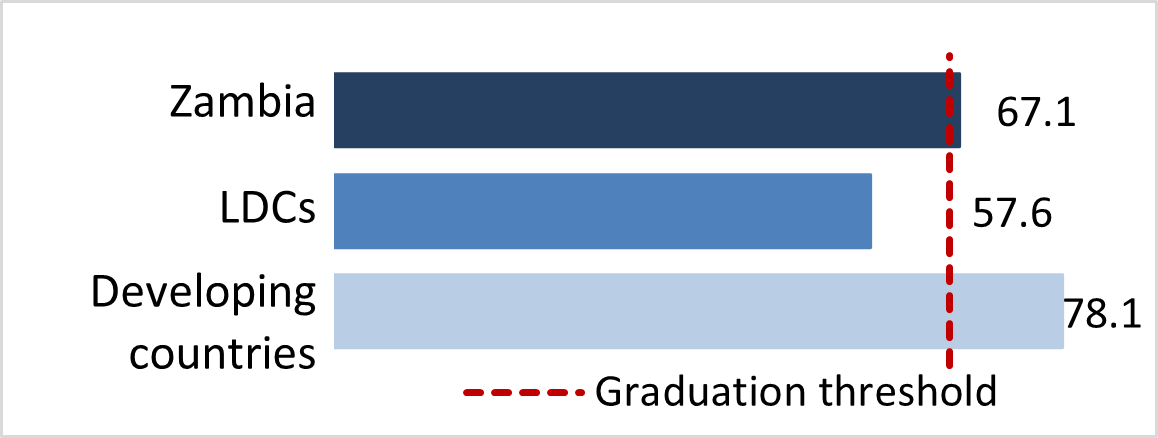
Human assets index (HAI)*
 |
Index: |
67.1 |
 |
|||
Thresholds |
||||||
| Inclusion: | 60 or below | |||||
| Graduation: | 66 or above | |||||
HAI indicators |
||||||
Under-five mortality rate |
Gross secondary school enrolment ratio |
|||||
 |
Value: | 61.7 |  |
Value: | 46.4 | |
| Index: | 68.7 | Index: | 40.4 | |||
| Source: | UN IAG for Child Mortality Estimation | Source: | Zambia MoGE | |||
Prevalence of stunting |
Adult literacy rate |
|||||
 |
Value: | 32.9 |  |
Value: | 86.7 | |
| Index: | 39.2 | Index: | 82.3 | |||
| Source: | UNICEF/WHO/World Bank Joint Child Malnutrition Estimates | Source: | UNESCO | |||
Maternal Mortality Rate |
Gender parity index for gross secondary school enrolment |
|||||
 |
Value: | 213 |  |
Value: | 0.94 | |
| Index: | 82.6 | Index: | 89.2 | |||
| Source: | UN IAG for Maternal Mortality | Source: | CDP | |||
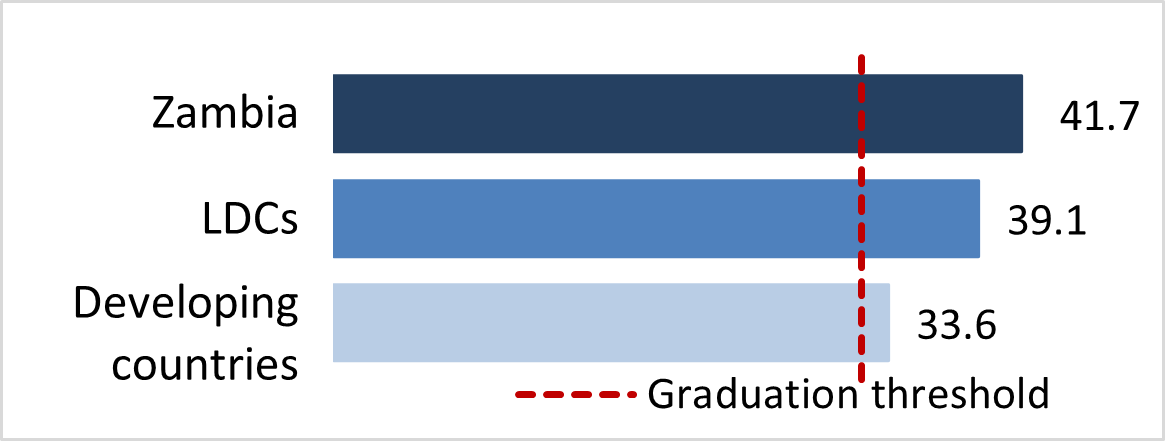
Economic and environmental vulnerability index (EVI)*
 |
Index: |
41.7 |
 |
|||
Thresholds |
||||||
| Inclusion: | 36 or above | |||||
| Graduation: | 32 or below | |||||
EVI indicators |
||||||
Share of agriculture, forestry and fishing in GDP |
Share of population in low elevated coastal zones |
|||||
 |
Value: | 3.6 |  |
Value: | 0.0 | |
| Index: | 4.4 | Index: | 0.0 | |||
| Source: | UN/DESA, Statistics Division | Source: | CIESIN | |||
Remoteness and landlockedness |
Share of population living in drylands |
|||||
 |
Value: | 80.6 |  |
Value: | 45.9 | |
| Index: | 88.3 | Index: | 45.9 | |||
| Source: | CDP | Source: | CDP | |||
Merchandise export concentration |
Instability of agricultural production |
|||||
 |
Value: | 0.67 |  |
Value: | 7.7 | |
| Index: | 67.2 | Index: | 33.6 | |||
| Source: | UNCTAD | Source: | FAO | |||
Instability of exports of goods and services |
Victims of disasters |
|||||
 |
Value: | 8.4 |  |
Value: | 1.76 | |
| Index: | 16.8 | Index: | 77.1 | |||
| Source: | UN/DESA, Statistics Division | Source: | EM-DAT | |||