 Welcome to the United Nations
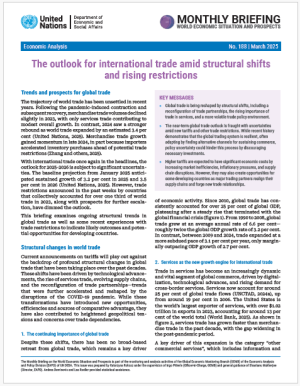
 The outlook for international trade amid structural shifts and rising restrictions

Trends and prospects for global trade
The trajectory of world trade has been unsettled in recent years. Following the pandemic-induced contraction and subsequent recovery, merchandise trade volumes declined slightly in 2023, with only services trade contributing to modest overall growth. In contrast, 2024 saw a stronger rebound as world trade expanded by an estimated 3.4 per cent (United Nations, 2025). Merchandise trade growth gained momentum in late 2024, in part because importers accelerated inventory purchases ahead of potential trade restrictions (Zhang and others, 2025). With international trade once again in the headlines, the outlook for 2025-2026 is subject to significant uncertainties. The baseline projection from January 2025 anticipated sustained growth of 3.2 per cent in 2025 and 3.5 per cent in 2026 (United Nations, 2025). However, trade restrictions announced in the past weeks by countries that collectively accounted for over one third of world trade in 2023, along with prospects for further escalation, have dimmed the outlook. This briefing examines ongoing structural trends in global trade as well as some recent experiences with trade restrictions to indicate likely outcomes and potential opportunities for developing countries.
Structural changes in world trade
Current announcements on tariffs will play out against the backdrop of profound structural changes in global trade that have been taking place over the past decades. These shifts have been driven by technological advancements, the rise of services trade, evolving supply chains, and the reconfiguration of trade partnerships—trends that were further accelerated and reshaped by the disruptions of the COVID-19 pandemic. While these transformations have introduced new opportunities, efficiencies and sources of comparative advantage, they have also contributed to heightened geopolitical tensions and concerns over trade dependencies.

1. The continuing importance of global trade
Despite these shifts, there has been no broad-based retreat from global trade, which remains a key driver of economic activity. Since 2010, global trade has consistently accounted for over 25 per cent of global GDP, plateauing after a steady rise that terminated with the global financial crisis (figure 1). From 1990 to 2008, global trade grew at an average annual rate of 6.6 per cent—roughly twice the global GDP growth rate of 3.2 per cent. In contrast, between 2009 and 2024, trade expanded at a more subdued pace of 3.1 per cent per year, only marginally outpacing GDP growth of 2.7 per cent.
2. Services as the new growth engine for international trade
Trade in services has become an increasingly dynamic and vital segment of global commerce, driven by digitalization, technological advances, and rising demand for cross-border services. Services now account for around 25 per cent of global trade flows (UNCTAD, 2024a), up from around 19 per cent in 2006. The United States is the world’s largest exporter of services, with over $1.02 trillion in exports in 2023, accounting for around 13 per cent of the world total (World Bank, 2025). As shown in figure 2, services trade has grown faster than merchandise trade in the past decade, with the gap widening in the post-pandemic period.  A key driver of this expansion is the category “other commercial services”, which includes information and communications technology (ICT) services. From 2005 to 2022, ICT services grew at an annual rate of over 10 per cent, exceeding growth in transport (6 per cent) and travel (3 per cent) (World Trade Organization, 2023). Many of these services are traded digitally, enabling remote cross-border transactions. The trade in digitally deliverable services, a broader category including several types of services, surged during the COVID-19 pandemic and has continued to expand (UNCTAD, 2024b; World Trade Organization, 2023). By 2023, this segment reached $4.25 trillion, accounting for 13.8 per cent of global exports of goods and services (World Trade Organization, 2024). World Trade Organization (2024) highlights the importance of artificial intelligence (AI) in transforming the patterns of trade in services. AI has contributed to the expansion of digitally delivered services, particularly in sectors such as education, human healthcare, recreation, and financial services, where AI-powered platforms enable remote learning, telemedicine, personalized content, and algorithm-driven financial analysis. As AI lowers costs and enhances service delivery, cross-border trade in these sectors is expected to grow further, reshaping global service markets. The rising relevance of trade in services is reflected in the United Nations Framework Convention on International Tax Cooperation, which directs the development of a protocol for taxing income from cross-border services in an increasingly digitalized and globalized economy (United Nations General Assembly, 2025). The expansion of services trade is transforming traditional economic models, challenging the long-held view that industrialization and manufacturing are the primary engines of development. While these sectors remain important, the increasing role of services—particularly digital and knowledge-based industries—is opening new pathways for economic progress (WTO and World Bank, 2023). Countries at various stages of development are finding opportunities to integrate into global trade through services, often bypassing the traditional industrialization route. Businesses and entrepreneurs in developing economies can now access global markets with fewer physical infrastructure requirements, making services trade a more inclusive growth avenue. At the same time, the increasing automation of manufacturing is reducing its capacity to generate large-scale employment, particularly in labour-abundant regions such as Africa. As a result, services-led development may be emerging as a viable alternative for job creation and economic expansion, requiring proactive action from policy makers (Rodrik and Sandhu, 2024).
 3. An increasingly multipolar global trade landscape

Over the past two decades, the global trade landscape has become increasingly multipolar. Following its accession to the WTO, China emerged as a key player, gradually diminishing the leading role of the United States and the European Union (figure 3). For instance, among Latin American economies, while the United States remains the primary trading partner for many, China has overtaken it in key markets such as Brazil, Chile, and Peru. In Africa, the United States no longer holds the position of principal trade partner for any country. At the same time, some large developing countries, such as Brazil and South Africa, have maintained strong intra-regional trade networks. In another indicator of growing multipolarity, the total number of Regional Trade Agreements in force increased from 83 in 2000 to 373 in 2024 (WTO (2025)). A rapidly evolving and uncertain U.S.-China trade relationship has accelerated shifts in global trade dynamics. For much of the past two decades, bilateral trade between the two countries expanded rapidly. In 2003, the United States exported $28 billion worth of merchandise to China while importing $152 billion. The trade deficit peaked in 2018, with U.S. merchandise exports to China totaling $120 billion and imports reaching $538 billion. By 2024, U.S. exports had risen to $143 billion, while imports declined to $438 billion. One key factor behind this decline is rising labor costs in China, which has driven some low- and mid-tech manufacturing to other countries, particularly ASEAN economies and Mexico. Between 2010 and 2022, average monthly earnings of employees (adjusted for purchasing power parity) in China grew at an annual rate of 9.6 per cent, compared, for example, to 4.1 per cent in the Philippines and 3.5 per cent in Mexico.  These shifts were further amplified by escalating trade tensions and the introduction of tariffs in 2018-2019, triggering a significant reconfiguration of global value chains in recent years (figure 4). As a result, some economies have benefited from trade diversion effects. Many “bystander” countries, whose exports serve as substitutes for tariffed Chinese goods, have seen increased demand (Fajgelbaum and others, 2021). Meanwhile, “connector” countries have experienced growth by absorbing trade flows that previously moved directly from China to the United States (Conteduca and others, 2025; Gopinath, 2024).
4. A more uncertain trade policy environment
The policy environment for the international trading system maintained relative stability until the mid-2010s even during periods of broader economic uncertainty (see figure 5). A marked shift occurred after 2015, when trade policy uncertainty began rising, reaching significant peaks during 2018 and 2020. These spikes in part reflected the impact of heightened trade tensions between the United States and China and the COVID-19 pandemic’s disruptions. Following a period of comparative calm in 2021-2023, trade policy uncertainty has risen sharply in recent months, largely driven by anticipated U.S. tariffs.  Caldara and others (2019) assess the impact of trade policy uncertainty on the U.S. economy, highlighting significant impacts on investment, trade volumes, and GDP. Higher trade policy uncertainty reduces industry investment, as firms hesitate to commit to long-term capital expenditures. The authors estimate that a one-unit increase in trade policy uncertainty decreases capital stock growth by 1.57 per cent. The overall impact on GDP is estimated to reach around -0.3 per cent within two years. The rise in trade policy uncertainty coincides with a sharp increase in discriminatory trade measures since 2015. For instance, between 2015 and 2023, the number of new trade restrictions rose sevenfold from 519 to 3,535 (see figure 6). This trend is largely fueled by the growing use of industrial subsidies, particularly among developed economies and several major developing countries. Compounding matters is the ongoing bottleneck in the WTO dispute settlement system, as the Appellate Body has been unable to function since 2019 due to the blockage of new appointments. Without a fully operational dispute resolution mechanism, trade conflicts have become harder to resolve, increasing unpredictability in global trade relations.
Impacts of U.S. trade policy changes
 Against the backdrop of gradually evolving trade dynamics, the United States introduced several significant trade measures in early 2025, including a 25 per cent tariff on all steel and aluminum imports and a 10 per cent blanket tariff on Chinese imports (on top of existing tariffs), later increased by another 10 per cent. A proposed 25 per cent tariff on Mexican and Canadian goods was temporarily suspended. Additional measures are under consideration, including potential reciprocal tariffs against all trading partners (The White House, 2025) and tariffs on European Union exports. The full impact of tariffs is expected to unfold gradually, with some measures possibly not taking effect until the second half of 2025. As a result, goods trade may continue to benefit from pre-tariff momentum in the near term (EIU, 2025).
How tariffs impact economies: key channels
Tariffs are a form of taxation on traded goods, imposed either by the importing or exporting country government. While export tariffs affect foreign buyers, import tariffs—the primary focus here—are paid by domestic importers generating revenue that is collected by the importing country government. By driving a wedge between the price paid by buyers and that received by sellers, import tariffs distort market dynamics and create both winners and losers. In general, the immediate burden of import tariffs can be distributed across exporters, importers, and consumers. In reality, it depends on a number of factors such as the ease of substitution of the affected goods, or the relative pricing power of firms in the value chain. If domestic alternatives are readily available, consumers may shift away from the imports subjected to tariffs, increasing demand for the domestic alternative while also forcing importing firms to either directly absorb most of the cost, renegotiate contracts with existing foreign suppliers, or source the item from suppliers in another country. Conversely, if substitutes are scarce or unavailable, consumers bear most of the price increase, as they have little choice but to continue purchasing the affected goods (Hersh and Bivens, 2025). Tariffs can serve several economic policy objectives, such as protecting infant industries and generating government revenue. By shielding domestic producers from foreign competition, tariffs may allow emerging industries to expand and, over time, become globally competitive (Hersh and Bivens, 2025). However, prolonged reliance on such protective measures can also backfire, fostering inefficiencies and reducing incentives for firms to innovate and enhance their competitiveness once the initial learning period has passed (Melitz, 2005). Additionally, tariffs can provide governments with an important source of revenue, particularly in economies where alternative tax collection mechanisms are weak. However, tariffs can also be a regressive form of revenue generation when they are disproportionately generated from goods consumed by poorer consumers. As mentioned earlier, tariffs introduce economic inefficiencies. First, artificially inflated prices may encourage the expansion of inefficient domestic production (Feenstra and Taylor, 2021). Second, higher prices reduce consumer welfare, with some buyers being priced out of the market for goods they would have otherwise purchased. These distortions contribute to welfare losses, where the overall economic cost of tariffs exceeds the combined benefits to domestic producers and government revenue (Clausing and Lovely, 2024). Moreover, tariffs on intermediate goods can raise production costs and drive up prices across a range of finished products, particularly in industries with highly integrated global supply chains (Cachanosky, 2025; Minges, 2024). For example, in North American automobile manufacturing, parts frequently cross borders multiple times during production. If tariffs are applied at each stage, costs accumulate, making final vehicles significantly more expensive (Bank of Canada, 2025). Such impacts increase prices for domestic consumers, reduce the competitiveness of exports in the world market, and contribute to inflationary pressures in the domestic economy. The expectation that tariffs could improve a country’s aggregate trade balance often proves illusory. While tariffs influence trade flows and price levels, a country’s trade balance is ultimately driven by the relationship between national savings and investment. If a country saves more than it invests, it runs a trade surplus; if it invests more than it saves, it runs a trade deficit, with imports helping meet domestic demand. While tariffs are expected to raise import prices and reduce import volumes, they do not directly affect national savings or investment levels. Any decline in imports is typically offset by a corresponding drop in total exports amid an appreciation of the domestic currency, leaving the trade balance largely unchanged (Mankiw, 2009; Blanchard, 2021). Tariffs can also be a powerful incentive for trade diversion and supply chain reconfiguration (Conteduca and others, 2024). Faced with tariffs, importers and producers may shift to alternative suppliers from countries not subject to the tariff, altering global trade patterns. While this reallocation can create opportunities for third countries, including developing economies, it also introduces inefficiencies. Firms may be forced to source inputs from higher-cost producers rather than the most competitive suppliers, raising production costs and reducing overall economic efficiency (Feenstra and Taylor, 2021). Many of these effects come into play when tariffs are expected to be long-lasting. Absent such certainty, firms may prefer to delay investment or relocation decisions. Affected industries, firms and special interest groups can also lobby for exemptions or compensatory transfers, further adding to the inefficient use of resources and market distortions (Grossman and Helpman (1994). Retaliatory action, whether through tariffs or other measures, impose further costs on a range of stakeholders.
Case Study: lessons from U.S.- China trade tensions
Although there are multiple channels through which tariffs can impact households and firms, the actual scope and scale of these effects remains to be empirically determined. Among the most extensively studied recent episodes is the 2018-2019 imposition of U.S. tariffs on various product categories, primarily aimed at Chinese imports and motivated by concerns over trade deficits. While each situation is unique, this earlier episode offers valuable insights for assessing the potential consequences of any new trade restrictions.

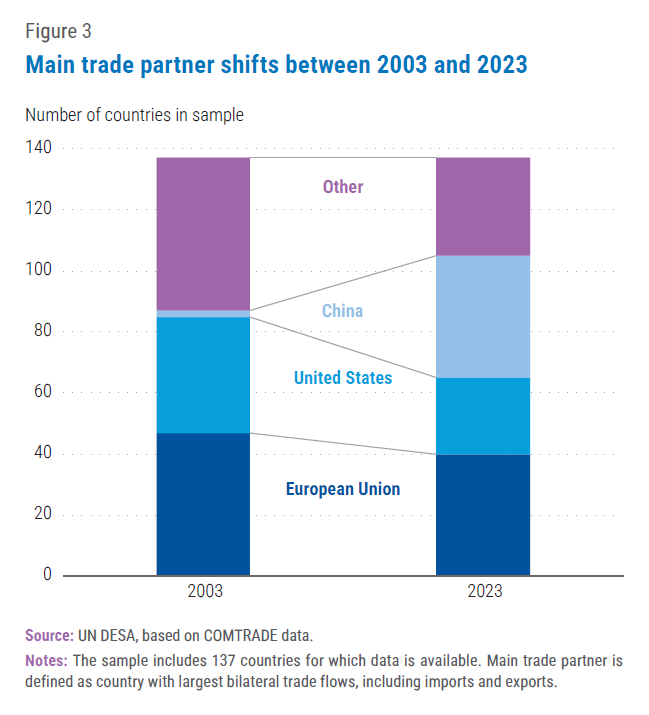
The 2018-2019 U.S. tariffs on China were implemented in several waves, starting with specific goods such as solar panels, washing machines, aluminum and steel, and eventually covering the majority of imported categories (figure 7). By 2019, these tariffs applied to 66.4 per cent of United States imports from China (Bown, 2019). The average tariff rate for Chinese imports into the United States increased from 3 per cent in 2017 to about 12.5 per cent by 2021 and remained elevated thereafter. In September 2024, further tariff increases were introduced, including 100 per cent tariffs on electric vehicles (EVs), 50 per cent on solar cells, and 25 per cent on electric vehicle batteries, critical minerals, steel, and aluminum. While some tariff exclusions provided limited relief, the broader tariff structure remained intact. China responded through tariffs targeting agricultural products, automobiles, and other key U.S. exports. By September 2019, China had imposed tariffs of 5 per cent to 25 per cent on $75 billion worth of United States goods. In January 2020, the China-U.S. Phase One Agreement was signed as a partial trade deal to ease escalating tensions between the two countries, with China agreeing to increase purchases of U.S. goods and enhance intellectual property protections in exchange for tariff relief. As part of the outcome, some tariffs were reduced, but many—especially on agricultural exports—remained (United States Trade Representative, 2020). As of 2024, China continued to tax over $100 billion worth of goods, affecting most U.S. exports to China, with rates ranging from 5 per cent to 50 per cent(Bown, 2019). The most impacted sectors include soybeans, corn, and pork, significantly straining farmers in the United States (Chu, 2024). Overall, Chinese tariffs on U.S. exports averaged about 15 per cent in early 2023. The economic impacts of these tariffs have been extensively studied, offering valuable insights into the potential consequences of current trade tensions. Tariffs are found to have raised prices, particularly for consumers in the United States. Amiti and others (2020) estimated that consumers in the United States bore nearly the entire burden of the tariffs, with steel being the sole exception. Additionally, tariffs on intermediate goods increased input costs for U.S. manufacturers, reducing competitiveness. Flaaen and Pierce (2019) found that any employment gains from import protection were offset by higher production costs and retaliatory tariffs, ultimately harming industries in the United States. Tariffs are estimated to have led to income and output losses in the United States. Amiti and others (2019) estimated that by December 2018, consumers and importing firms faced $3.2 billion in additional costs and $1.4 billion in efficiency losses each month. Fajgelbaum and others (2019) calculated an annual real income loss of $7.2 billion (0.04 per cent of GDP), after accounting for tariff revenue and domestic producer gains. Over the long term, York (2025) projected that the 2018-2019 tariffs would lead to a 0.2 per cent reduction in U.S. GDP, a 0.1 per cent decline in the capital stock, and a loss of 142,000 full-time equivalent jobs compared to a baseline scenario without tariffs. At the same time, the trade conflict adversely affected China. Jiao and others (2023) found that firm-level export prices—including U.S. tariffs—increased by an average of 1 per cent, resulting in a 4.2 per cent decline in exports to the United States and a drop in profit margins for China’s exporting firms by 0.35 percentage points. Benguria and others (2022) estimated that a one-standard deviation increase in trade policy uncertainty—caused by increases in U.S. tariffs and Chinese retaliatory tariffs in 2018-19—reduced firm-level investment, research and development expenditures, and profits in China by 2.3 per cent, 2.3 per cent and 11.5 per cent, respectively. 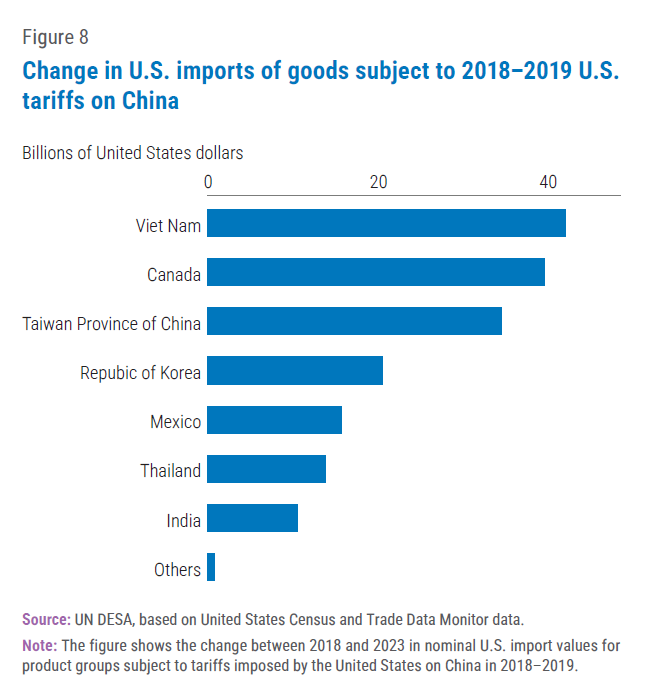 Between 2018 and 2023, U.S. imports of the goods under tariff from China fell by $205 billion, with $177 billion shifting to alternative suppliers and a net demand reduction of $28 billion. Canada, Taiwan Province of China and Viet Nam developed into significant alternative sources (figure 8), while India and Thailand also captured a portion of the redirected trade. While a significant share of trade was rerouted, overall demand for these imports declined. The overall U.S. merchandise trade deficit with China narrowed from a peak of $418 billion in 2018 to $295 billion in 2024.
Opportunities for developing countries: one scenario
Should U.S. tariffs continue to target bilateral trade deficits, a breakdown by product category provides insight into which countries may benefit from supplying substitutes for tariff-affected goods. Figures 9a and 9b detail the top ten U.S. net import product categories in 2024, distinguishing between high-tech and mid-/low-tech products. Among high-tech products, China remains a major supplier of electronics and machinery to the United States. The United States also maintains substantial trade imbalances with Canada and Mexico, driven by large imports of vehicles, machinery, and electronics. Meanwhile, the European Union remains a key source of pharmaceutical and machinery imports. Several East Asian economies, such as Malaysia and Singapore, are emerging as specialized component producers in consumer electronics (Kratz, Piper and Bouchaud, 2025). However, outside of East Asia and Mexico, most developing countries lack the industrial capacity and supply chain integration needed to replace major high-tech suppliers. By contrast, a realignment of supply chains in more labour-intensive low- and mid-tech industries could create new opportunities for a broader set of developing countries. East Asia is well-positioned to benefit, but other regions could also gain if the United States shifts away from its main trading partners China, Canada, Mexico, and the European Union. While U.S. imports in these sectors are smaller in value, many industries—such as toys, apparel, footwear, and furniture—were exempt from tariffs on China until early 2025. However, the introduction of a 10 per cent tariff on all Chinese products in February 2025, and its subsequent increase by an additional 10 per cent in March 2025 is expected to raise import costs, reinforcing the declining cost competitiveness of Chinese manufacturers and possibly prompting companies to explore alternative suppliers (Fukuoka, 2020). In toys, the United States remains heavily dependent on China, which supplies over 75 per cent of imports. Viet Nam, which currently supplies 7 per cent of U.S. imports, and Indonesia, which sells 70 per cent of its growing toys output to the United States, could emerge as alternative suppliers. In apparel, Bangladesh, Viet Nam, Cambodia, Indonesia and India have strengthened their market positions, and the five countries together already supply over 40 per cent of U.S. apparel imports. At the same time, some Latin American and African countries may also have the potential to increase their exports, thanks to existing capabilities, abundant labor force, and some trade concessions such as the African Growth and Opportunity Act (Kratz, Piper and Bouchaud, 2025). Similarly, in footwear, as second and fourth largest world exporters, Viet Nam and Indonesia may partly replace Chinese supply.
Resilience and adaptation in global trade
Numerous analyses are currently underway to better understand the evolving dynamics of trade tensions and their potential impacts. For example, the Peterson Institute for International Economics maintains a timeline of new developments (Bown, 2025). The Tax Foundation continuously updates its modeled estimates of various trade restriction scenarios, particularly those involving the United States (York, 2025). The overall uncertainty surrounding trade restrictions adds an important layer of risk, potentially dampening business confidence, delaying investment decisions, and disrupting supply chain planning. Over the longer term, these dynamics could drive significant structural adjustments in global value chains, manufacturing capabilities, and export capacities – not only in the United States, but also many other countries around the world - amid broader shifts in investment patterns.
Despite recent tariff announcements and their immediate impacts, the global trading system has historically demonstrated remarkable resilience, consistently finding alternative channels to maintain commercial flows. While some economies may face short-term disruptions from restrictive trade measures, others—particularly developing countries—could find opportunities to strengthen regional networks and fill emerging supply chain gaps. The rapid growth of trade in services, fueled by digitalization and AI expansion, presents new avenues for economic growth. Furthermore, as additional tariffs affect existing suppliers of manufactured goods to the United States, countries that have successfully developed their manufacturing capabilities and trade linkages, may gain a competitive edge. The multilateral trading system, though under mounting pressure, remains crucial for safeguarding development gains achieved through trade. Its preservation and adaptation to emerging challenges will be vital for ensuring that international commerce continues to serve as an engine of global economic growth and development.