 Welcome to the United Nations
* Data from the 2021 triennial review
Bangladesh country profile in PDF
LDC status
 |
Inclusion: 1975Graduation: Scheduled to graduate in 2026 |
Reports and resolutions
 |
Inclusion |
| CDP report: 1975 | |
| ECOSOC resolution: E/RES/1976(LIX) | |
| GA resolution: A/RES/3487(XXX) | |
Graduation |
|
| CDP report: 20182021 | |
| ECOSOC resolution: E/RES/2021/11 | |
| GA resolution: A/RES/76/8 | |
| Impact assessment: 2021 | |
| Vulnerability profile: 2021 | |
| Country presentation: 2021 CDP EGM presentation | |
| Country statement: 2021 CDP EGM Plenary Statement, 2021 CDP EGM Plenary Statement-Annex | |
| Monitoring reports: 2022, 2023 |
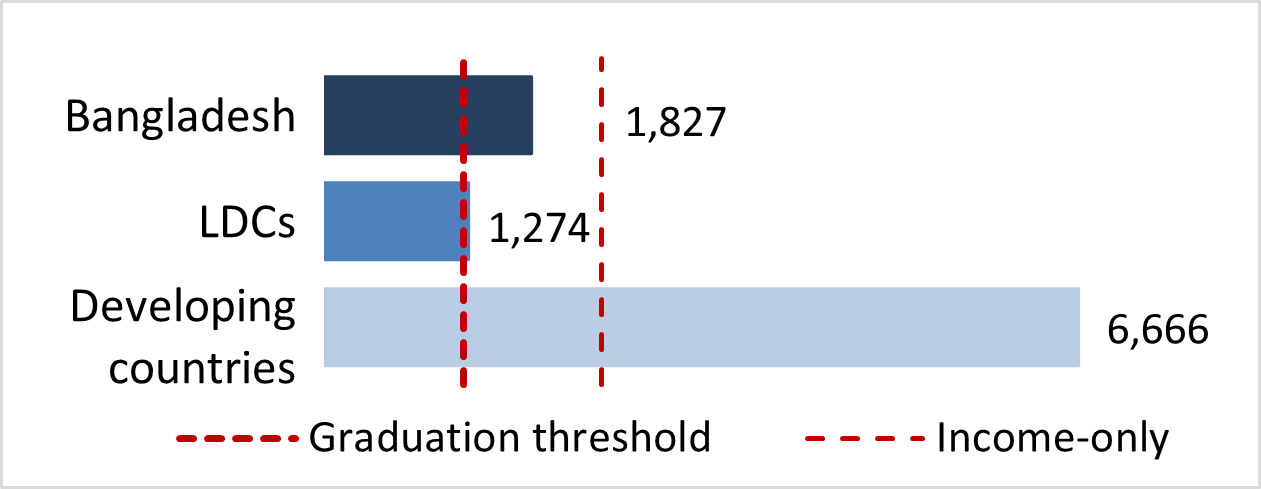
Gross national income (GNI) per capita*
|
|
Value: |
$ 1,827 |
 |
|||
Thresholds |
||||||
| Inclusion: | $ 1,018 | |||||
| Graduation: | $ 1,222 | |||||
| Income-only graduation: | $ 2,444 | |||||

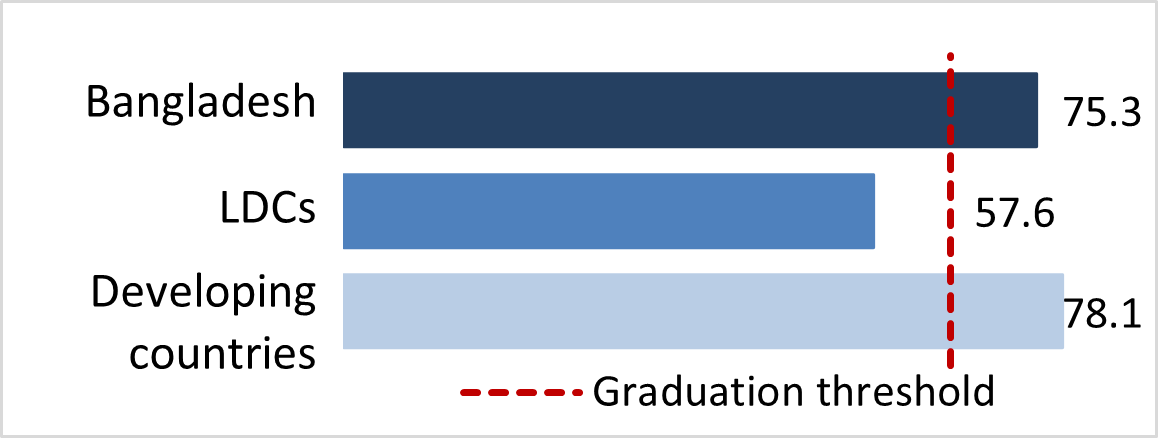
Human assets index (HAI)*
 |
Index: |
75.3 |
 |
|||
Thresholds |
||||||
| Inclusion: | 60 or below | |||||
| Graduation: | 66 or above | |||||
HAI indicators |
||||||
Under-five mortality rate |
Gross secondary school enrolment ratio |
|||||
 |
Value: | 30.8 |  |
Value: | 72.6 | |
| Index: | 87.4 | Index: | 69.5 | |||
| Source: | UN IAG for Child Mortality Estimation | Source: | UNESCO | |||
Prevalence of stunting |
Adult literacy rate |
|||||
 |
Value: | 31.0 |  |
Value: | 74.7 | |
| Index: | 43.0 | Index: | 66.2 | |||
| Source: | UNICEF/WHO/World Bank Joint Child Malnutrition Estimates | Source: | UNESCO | |||
Maternal Mortality Rate |
Gender parity index for gross secondary school enrolment |
|||||
 |
Value: | 173 |  |
Value: | 1.17 | |
| Index: | 85.9 | Index: | 100.0 | |||
| Source: | UN IAG for Maternal Mortality | Source: | UNESCO | |||
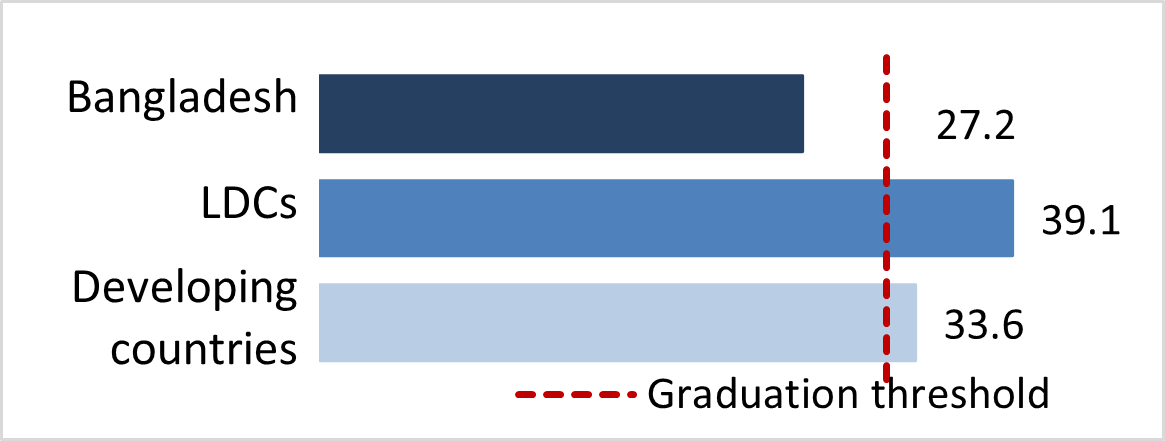
Economic and environmental vulnerability index (EVI)*
 |
Index: |
27.2 |
 |
|||
Thresholds |
||||||
| Inclusion: | 36 or above | |||||
| Graduation: | 32 or below | |||||
EVI indicators |
||||||
Share of agriculture, forestry and fishing in GDP |
Share of population in low elevated coastal zones |
|||||
 |
Value: | 13.8 |  |
Value: | 8.4 | |
| Index: | 21.7 | Index: | 23.9 | |||
| Source: | UN/DESA, Statistics Division | Source: | CIESIN | |||
Remoteness and landlockedness |
Share of population living in drylands |
|||||
 |
Value: | 37.8 |  |
Value: | 0.0 | |
| Index: | 34.8 | Index: | 0.0 | |||
| Source: | CDP | Source: | CDP | |||
Merchandise export concentration |
Instability of agricultural production |
|||||
 |
Value: | 0.41 |  |
Value: | 3.1 | |
| Index: | 36.0 | Index: | 8.4 | |||
| Source: | UNCTAD | Source: | FAO | |||
Instability of exports of goods and services |
Victims of disasters |
|||||
 |
Value: | 2.7 |  |
Value: | 3.86 | |
| Index: | 5.4 | Index: | 87.5 | |||
| Source: | UN/DESA, Statistics Division | Source: | EM-DAT | |||