 Welcome to the United Nations
* Data from the 2021 triennial review
Equatorial Guinea Snapshot in PDF
LDC status
 |
Inclusion: 1982Graduation: 2017 |
Reports and resolutions
 |
Inclusion |
| CDP reports: 1981, 1982 | |
| ECOSOC resolutions: E/DEC/1980/161, E/DEC/1982/106, E/RES/1982/41 | |
| GA resolutions: A/RES/35/106, A/RES/37/133 | |
Graduation |
|
| CDP reports: 2009, 2010, 2011, 2012, 2014, 2015, 2016, 2017, 2018 | |
| ECOSOC resolutions: E/RES/2009/35, E/RES/2011/20, E/RES/2012/32 | |
| GA resolution: A/RES/68/18 | |
| Impact assessment: 2009 | |
| Vulnerability profile: 2009 | |
| Country statement: 2009 CDP EGM, 2009 CDP Plenary - English, 2009 CDP Plenary - Spanish | |
| Monitoring reports: 2010, 2011, 2012, 2014, 2015, 2016, 2017, 2018, 2019, 2020, 2021 |
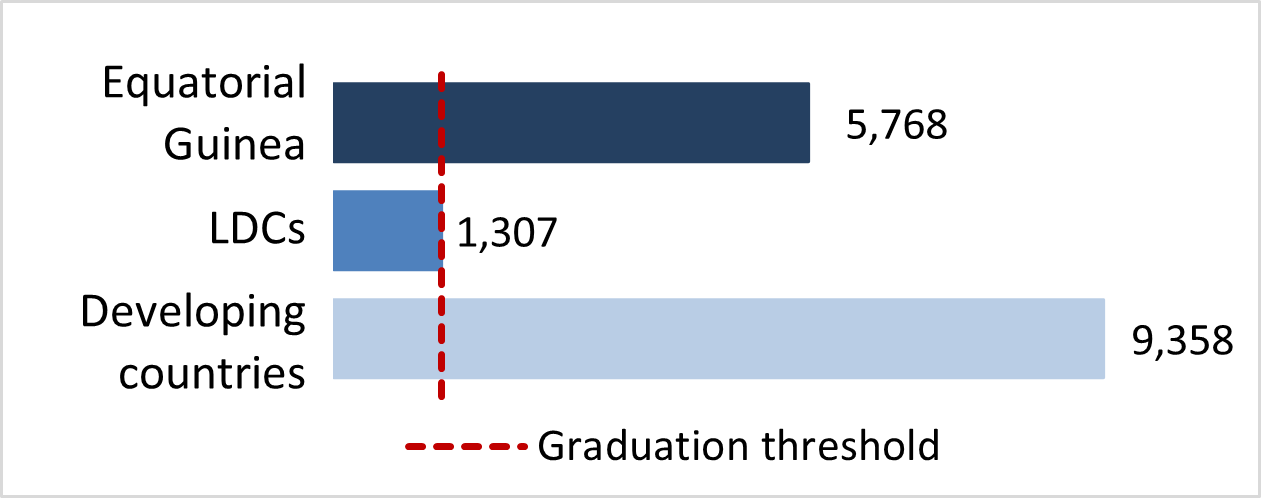
Gross national income (GNI) per capita*
|
|
Value: |
$ 7,617 |
 |
|||
Thresholds |
||||||
| Inclusion: | $ 1,018 | |||||
| Graduation: | $ 1,222 | |||||
| Income-only graduation: | $ 2,444 | |||||

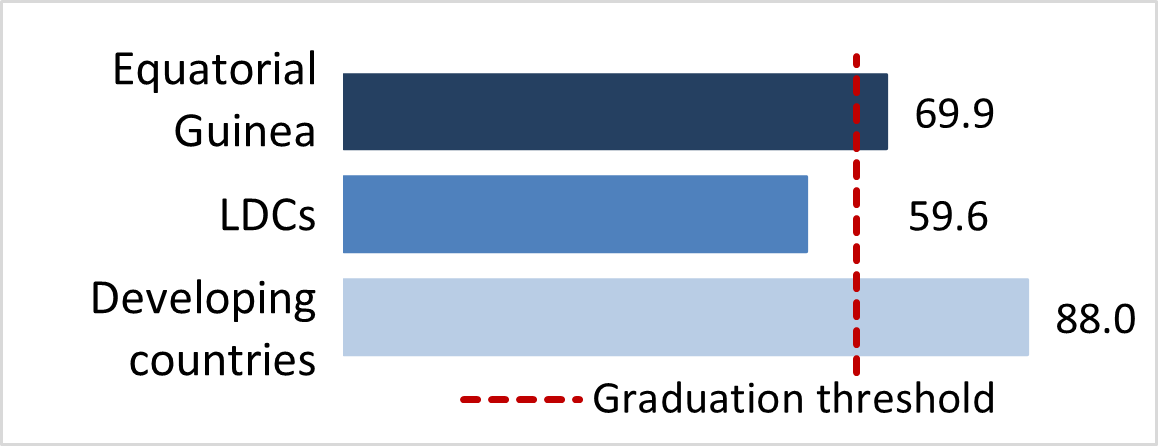
Human assets index (HAI)*
 |
Index: |
67.1 |
 |
|||
Thresholds |
||||||
| Inclusion: | 60 or below | |||||
| Graduation: | 66 or above | |||||
HAI indicators |
||||||
Under-five mortality rate |
Gross secondary school enrolment ratio |
|||||
 |
Value: | 81.8 |  |
Value: | 29.3 | |
| Index: | 56.5 | Index: | 21.4 | |||
| Source: | UN IAG for Child Mortality Estimation | Source: | CDP | |||
Prevalence of stunting |
Adult literacy rate |
|||||
 |
Value: | 20.5 |  |
Value: | 94.4 | |
| Index: | 64.0 | Index: | 92.5 | |||
| Source: | UNICEF/WHO/World Bank Joint Child Malnutrition Estimates | Source: | UNESCO | |||
Maternal Mortality Rate |
Gender parity index for gross secondary school enrolment |
|||||
 |
Value: | 301 |  |
Value: | 0.96 | |
| Index: | 75.2 | Index: | 92.8 | |||
| Source: | UN IAG for Maternal Mortality | Source: | CDP | |||
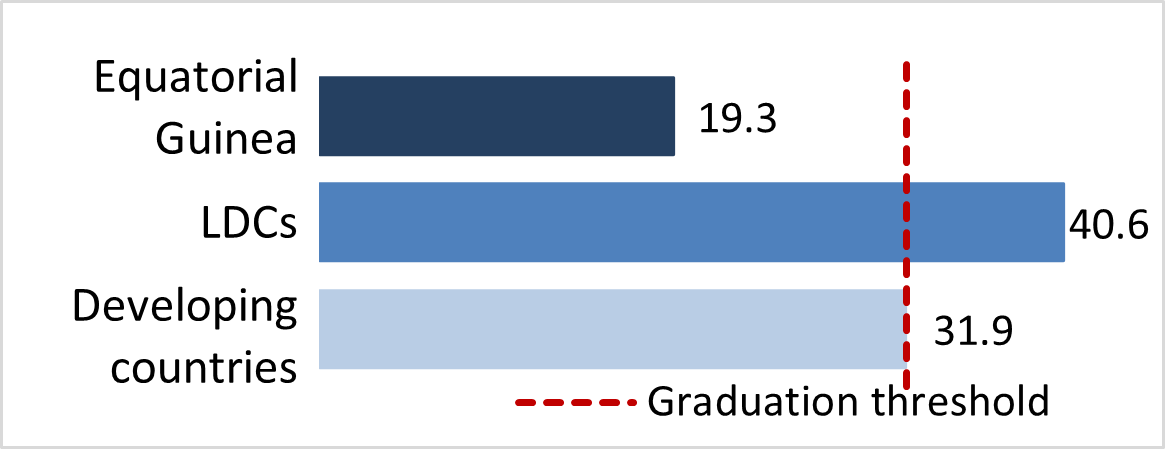
Economic and environmental vulnerability index (EVI)*
 |
Index: |
18.7 |
 |
|||
Thresholds |
||||||
| Inclusion: | 36 or above | |||||
| Graduation: | 32 or below | |||||
EVI indicators |
||||||
Share of agriculture, forestry and fishing in GDP |
Share of population in low elevated coastal zones |
|||||
 |
Value: | 2.4 |  |
Value: | 5.7 | |
| Index: | 2.3 | Index: | 16.2 | |||
| Source: | UN/DESA, Statistics Division | Source: | CIESIN | |||
Remoteness and landlockedness |
Share of population living in drylands |
|||||
 |
Value: | 49.1 |  |
Value: | 0.0 | |
| Index: | 48.8 | Index: | 0.0 | |||
| Source: | CDP | Source: | CDP | |||
Merchandise export concentration |
Instability of agricultural production |
|||||
 |
Value: | 0.65 |  |
Value: | 1.5 | |
| Index: | 64.7 | Index: | 0.0 | |||
| Source: | UNCTAD | Source: | FAO | |||
Instability of exports of goods and services |
Victims of disasters |
|||||
 |
Value: | 8.7 |  |
Value: | 0.0 | |
| Index: | 17.4 | Index: | 0.0 | |||
| Source: | UN/DESA, Statistics Division | Source: | EM-DAT | |||