 Welcome to the United Nations
* Data from the 2024 triennial review
Timor-Leste Snapshot in PDF
LDC status
 |
Inclusion: 2003 |
Reports and resolutions
 |
Inclusion |
| CDP report: 2003 | |
| ECOSOC resolution: E/DEC/2003/280 | |
| GA resolution: A/RES/58/112 | |
Graduation |
|
| CDP reports: 2015, 2018, 2021, 2024 | |
| Impact assessment: 2018 | |
| Vulnerability profile: 2018 | |
| Country statements: 2018 CDP EGM statement, 2021 CDP EGM statement, 2021 CDP Plenary statement, 2024 CDP EGM statement |
Gross national income (GNI) per capita*
|
|
Value: |
$ 2,314 |
 |
|||
Thresholds |
||||||
| Inclusion: | $ 1,088 | |||||
| Graduation: | $ 1,306 | |||||

Human assets index (HAI)*
 |
Index: |
65.6 |
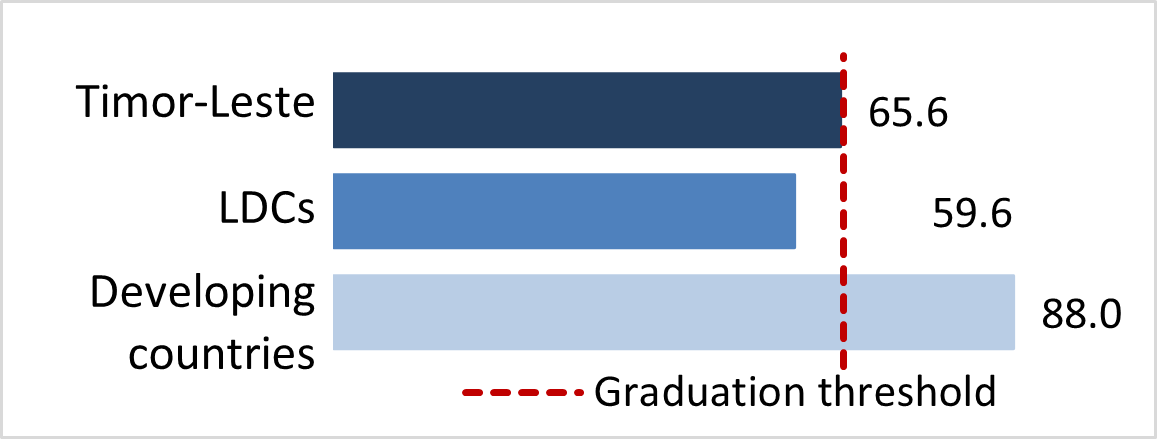 |
|||
Thresholds |
||||||
| Inclusion: | 60 or below | |||||
| Graduation: | 66 or above | |||||
HAI indicators |
||||||
Under-five mortality rate |
Lower secondary education completion rate |
|||||
 |
Value: | 48.6 |  |
Value: | 63.0 | |
| Index: | 76.6 | Index: | 58.8 | |||
| Source: | UN IAG for Child Mortality Estimation | Source: | UNESCO | |||
Prevalence of stunting |
Adult literacy rate |
|||||
 |
Value: | 45.1 | Value: | 69.9 | ||
| Index: | 14.8 | Index: | 59.9 | |||
| Source: | UNICEF/WHO/World Bank Joint Child Malnutrition Estimates | Source: | UNESCO | |||
Maternal Mortality Rate |
Gender parity index for lower secondary education completion |
|||||
 |
Value: | 204 | Value: | 1.2 | ||
| Index: | 83.4 | Index: | 100.0 | |||
| Source: | UN IAG for Maternal Mortality | Source: | UNESCO | |||
Economic and environmental vulnerability index (EVI)*
 |
Index: |
41.3 |
 |
|||
Thresholds |
||||||
| Inclusion: | 36 or above | |||||
| Graduation: | 32 or below | |||||
EVI indicators |
||||||
Share of agriculture, forestry and fishing in GDP |
Share of population living in low elevated coastal zones |
|||||
 |
Value: | 10.7 |  |
Value: | 3.0 | |
| Index: | 16.4 | Index: | 8.5 | |||
| Source: | UN/DESA, Statistics Division | Source: | CIESIN | |||
Remoteness and landlockedness |
Share of population living in drylands |
|||||
 |
Value: | 63.7 |  |
Value: | 3.1 | |
| Index: | 67.1 | Index: | 3.1 | |||
| Source: | CDP Secretariat | Source: | CDP Secretariat | |||
Merchandise export concentration |
Instability of agricultural production |
|||||
| Value: | 7.6 |  |
Value: | 5.3 | ||
| Index: | 60.6 | Index: | 20.6 | |||
| Source: | UNCTAD | Source: | FAO | |||
Instability of exports of goods and services |
Victims of disasters |
|||||
 |
Value: | 57.0 |  |
Value: | 1.08 | |
| Index: | 100.0 | Index: | 53.9 | |||
| Source: | UN/DESA, Statistics Division | Source: | UNDRR | |||