 Understanding the external imbalances of the United States
Introduction
On 2 April 2025, the Government of the United States announced a universal ‘reciprocal tariff’ of 10 per cent on most of its trading partners, which came into effect on 5 April, under the authority of the International Emergency Economic Powers Act (IEEPA) (The White House, 2025). In addition, over 80 countries are subject to further tariffs, potentially taking effect on 1 August 2025, with rates largely based on their bilateral trade balances with the United States.
This reciprocal tariff policy is primarily grounded in the view that persistent goods trade deficits have significantly contributed to the erosion of the United States’ manufacturing base, prompting the declaration of a national emergency under the IEEPA. While the relationship between persistent trade deficits and the decline of the manufacturing sector is complex and shaped by factors such as the broader trend of de-industrialization in developed economies, the level of the U.S. dollar, and its impact on export competitiveness, the perspective presented in the Executive Order is not new.
Since 1990, the goods trade deficit of the United States as a share of gross domestic product (GDP) has varied between 1.2 per cent and 6.2 per cent, with a median value of 4.2 per cent. That is indicative of a sustained demand for imports from other countries, contributing to economic growth across the world. At the same time, the flip side has been the continuing accumulation of U.S. external liabilities by other countries, contributing to global imbalances and potential financial instabilities.
Addressing global trade imbalances has long been a central topic in international economic fora, such as the Group of Twenty (G20). For its part, the United States has pursued efforts to rebalance trade relationships, particularly with countries such as China and Japan, which have historically maintained substantial bilateral trade surpluses with the United States. For example, from 1989 to 1990, the United States and Japan were engaged in the Structural Impediments Initiative negotiations to address structural barriers to increasing U.S. exports to Japan.
In the World Economic Situation and Prospects 2025 mid-year update, global growth projections for 2025 and 2026 have been revised downward. The most significant factor cited is the uncertainty introduced by the United States’ latest trade policy actions aimed at addressing the imbalances. At this juncture, it is important to reassess the current state of external imbalances of the United States. Doing so will help evaluate the broader implications for the global economy, particularly for developing countries.
This Monthly Briefing examines how the U.S. trade and current account deficits have accumulated over time, contributing to the growth of the external liabilities, which in turn have led to non-residents’ holdings of U.S. financial assets becoming a significant proportion of the total financial assets of the United States. The analysis is based on data from the International Economic Accounts (United States, Bureau of Economic Analysis, 2025) and the Integrated Macroeconomic Accounts (IMA) section of the Financial Accounts of the United States (Federal Reserve, 2025).
Trade balance deficits of the United States
Throughout the 1960s and early 1970s, the United States maintained relatively stable trade and current account surpluses, averaging approximately 0.5 per cent of GDP. Beginning in 1976, the U.S. trade balance in goods and services shifted into a persistent deficit. The current account has remained negative since 1976, except for 1980, 1981, and 1991, when the U.S. economy was in recession. During those periods, weakened domestic demand led to reduced imports, resulting in surpluses in the current account.
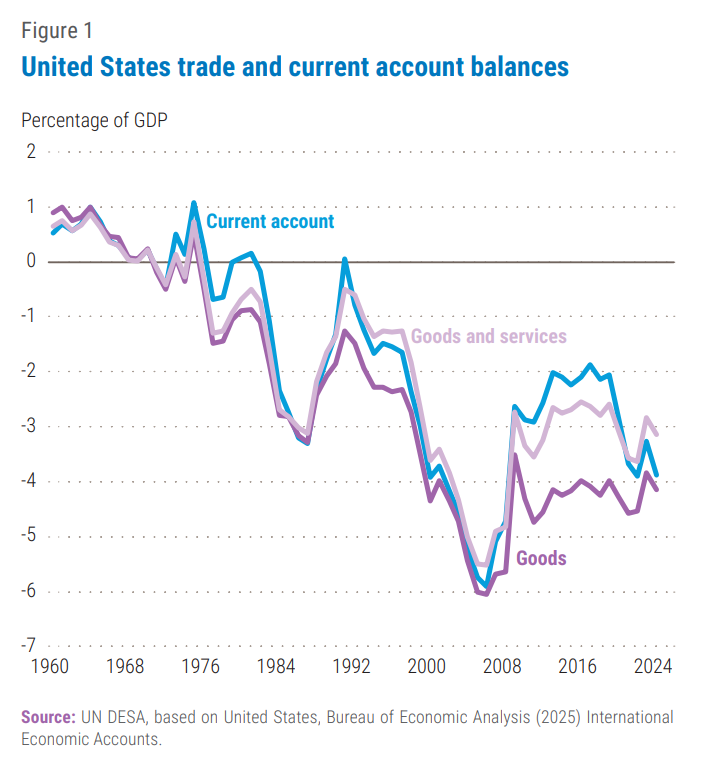 While the goods trade balance has consistently been in deficit, the services trade balance has generally remained in surplus, along with net investment income. These surpluses have partially offset the goods trade deficit, resulting in current account deficits that are smaller in magnitude than the goods trade deficits (figure 1). The current account deficit reached a peak of 5.9 per cent of GDP in 2006. It declined in the years that followed, supported in part by growing surpluses in the services trade. However, the deficit began to widen again after 2019. In absolute dollar terms, the trade and current account deficits reached a historic high in 2024. Nevertheless, when measured as a share of GDP, the magnitude of the deficit, particularly the goods trade deficit, has remained relatively stable since the global financial crisis of 2008‒09.
External liabilities as the cumulative outcome of current account deficits
A trade deficit means that a country’s national income in a given year is insufficient to match the value of its imports. To finance the shortfall, the country must either sell assets to non-residents or borrow from abroad. In the United States, the cumulative result of decades of current deficits has been a steady increase in net external liabilities, often represented by a negative value in the net international investment position (NIIP). By the end of 2024, the U.S. NIIP had reached negative $26 trillion, equivalent to approximately 90 per cent of GDP. A similar measure in the Integrated Macroeconomic Accounts, the net worth of the “rest of the world” sector stood at $25 trillion, or 84 per cent of GDP.
From a macroeconomic perspective, the relationship between trade balances and external liabilities can be illustrated using the national income identity:
Y ≡ C + I + G + (X - M)
Where: Y=GDP (national income), C=Consumption, I=Investment, G=Government spending, X−M=Net exports (exports minus imports) are all measured over the same time period.
From this, net exports represent the difference between national income and total expenditure. If a country consistently spends more than it produces, namely Y < (C + I + G), X – M < 0, it must finance the gap by borrowing from abroad, leading to an accumulation of external liabilities over the years. This gap also reflects an investment-savings imbalance, where foreign borrowing funds investment at levels beyond what is possible through domestic savings.
Figure 2 illustrates the U.S. current account deficits, cumulatively summed since 1960, alongside net external liabilities as a percentage of GDP. The cumulative current account remained in surplus until 1982, turning negative in 1983. From that point, deficits accumulated rapidly, outpacing nominal GDP growth until 2010, when the cumulative deficit reached 54.4 per cent of GDP. Since then, the cumulative current account deficit has stabilized at around 55 per cent of GDP, suggesting that annual deficits have grown roughly in line with nominal GDP, resulting in no significant further accumulation relative to the size of the economy.
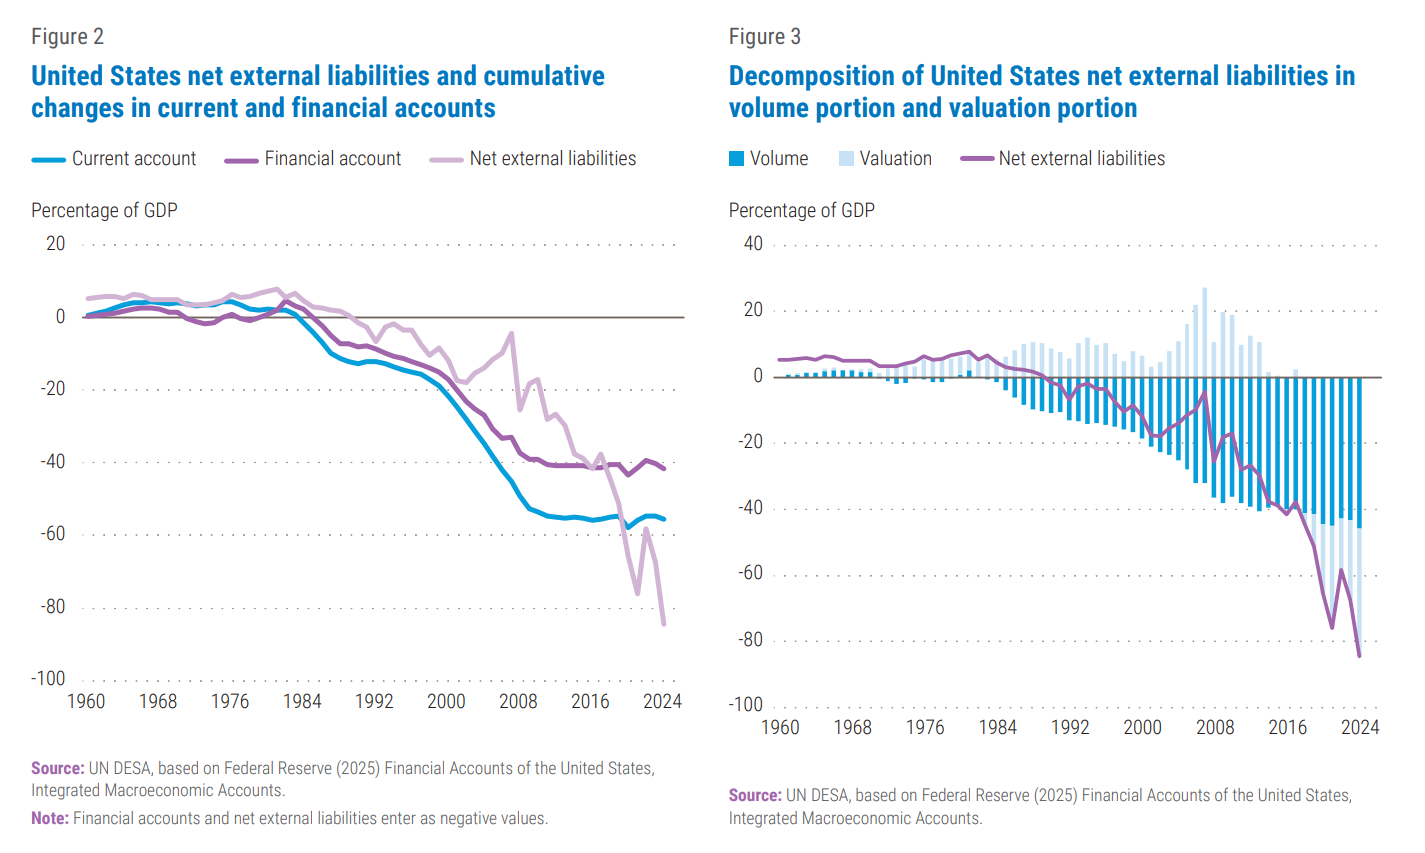
Figure 2 also includes the cumulative financial account balance, plotted as a negative value (i.e., multiplied by –1) to allow for direct visual comparison with the cumulative current account deficit. The difference between the cumulative current account and financial account balances reflects the capital account (typically very small), and statistical discrepancies. The cumulative financial account balance has also stabilized as a share of GDP since 2010. The cumulative financial accounts balance has closely tracked the growth in net external liabilities, but the growth of external liabilities has been much steeper since 2017. Between 2017 and 2024, the U.S. external liabilities have jumped from 37 per cent of GDP to 84 per cent of GDP, while both cumulative current and financial accounts balance, in terms of GDP, have been relatively stable.
Figure 3 illustrates the decomposition of net external liabilities into two components: volume changes—primarily reflecting the net acquisition of U.S. financial assets by non-residents versus U.S. residents’ acquisition of foreign assets—and valuation changes. The volume portion corresponds to the cumulative financial accounts in figure 2, and the value portion reflects the change of value in both U.S. and foreign financial assets. When the value portion is positive, the value of foreign assets rises relative to the U.S. assets and when the value portion is negative, the value of the U.S. assets rises relative to external assets. The value portion of the net external liabilities had been positive for a long time until 2015 and became negative in 2018 and quickly accumulated. This can be explained by the compound impact of appreciation of the U.S. dollar against other currencies and the steep rise in the value of U.S. stock markets, which outperformed most markets.
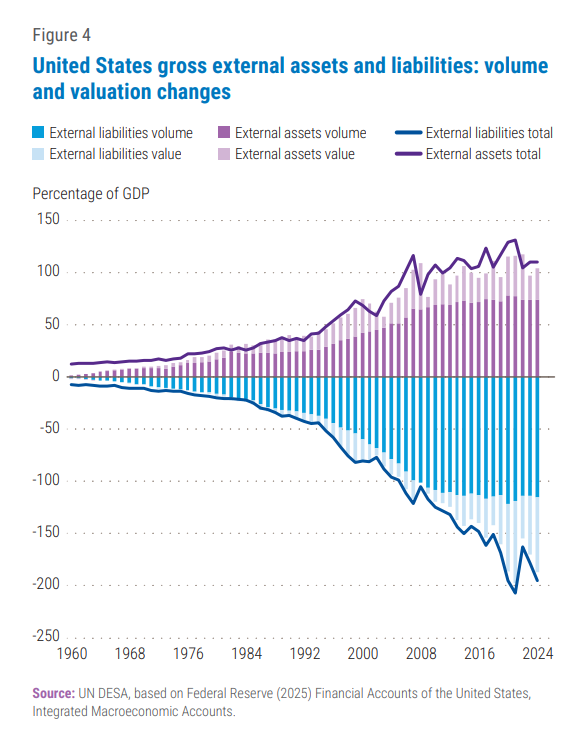 Figure 4 illustrates a further decomposition of the United States’ net external liabilities into gross external assets and liabilities. While the volume component has remained relatively stable as a share of GDP since 2010, the value component has continued to fluctuate—particularly on the liabilities side, where its contribution has increased. Notably, during the period of rapid increase in trade and current account deficits from 1984 to 2010, both gross external assets and liabilities grew significantly in volume. Since 2010, the growth of the volume component has stabilized in terms of GDP, in line with the trade and current account deficits, while the dynamics of external liabilities have been increasingly driven by valuation effects.
Net external liabilities in the U.S. balance sheet
While the United States’ net external liabilities may appear alarmingly high when expressed as a share of GDP, a broader perspective that includes the financial assets and liabilities of households, corporations, government, and the rest of the world provides a more complete picture of the country’s overall financial position. At the end of 2024, the gross total of financial assets in the United States reached $382 trillion—approximately 13 times the size of GDP. The gross total of financial assets is equal to the gross total of financial liabilities, after accounting for statistical discrepancies.
Between 1960 and the mid-1980s, the size of gross total financial assets hovered around 5.5 times GDP but has since risen steadily as the economy became increasingly financialized. The share of financial assets held by non-residents has followed an upward trend to reach 14.9 per cent in 2024 (figure 5). The share of U.S. residents’ claims on foreign assets in total assets peaked at 10 per cent in 2007 and has since stagnated, standing at 8.4 per cent in 2024. The data suggests a decline in the share of gross external assets within the total gross financial assets held by U.S. residents.
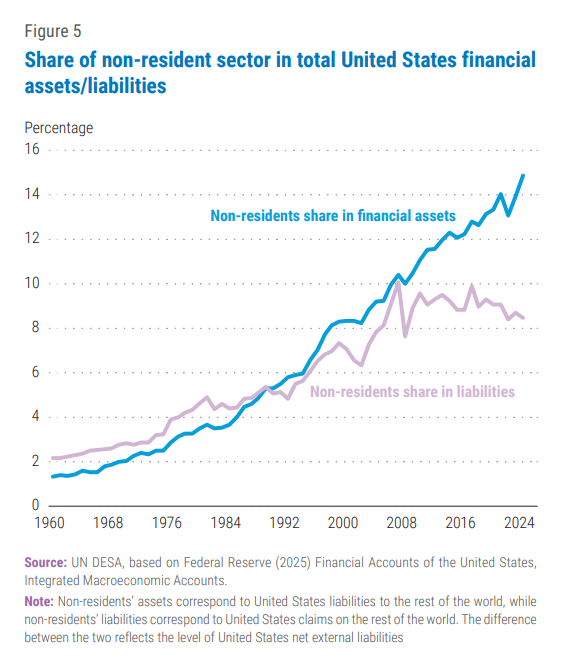
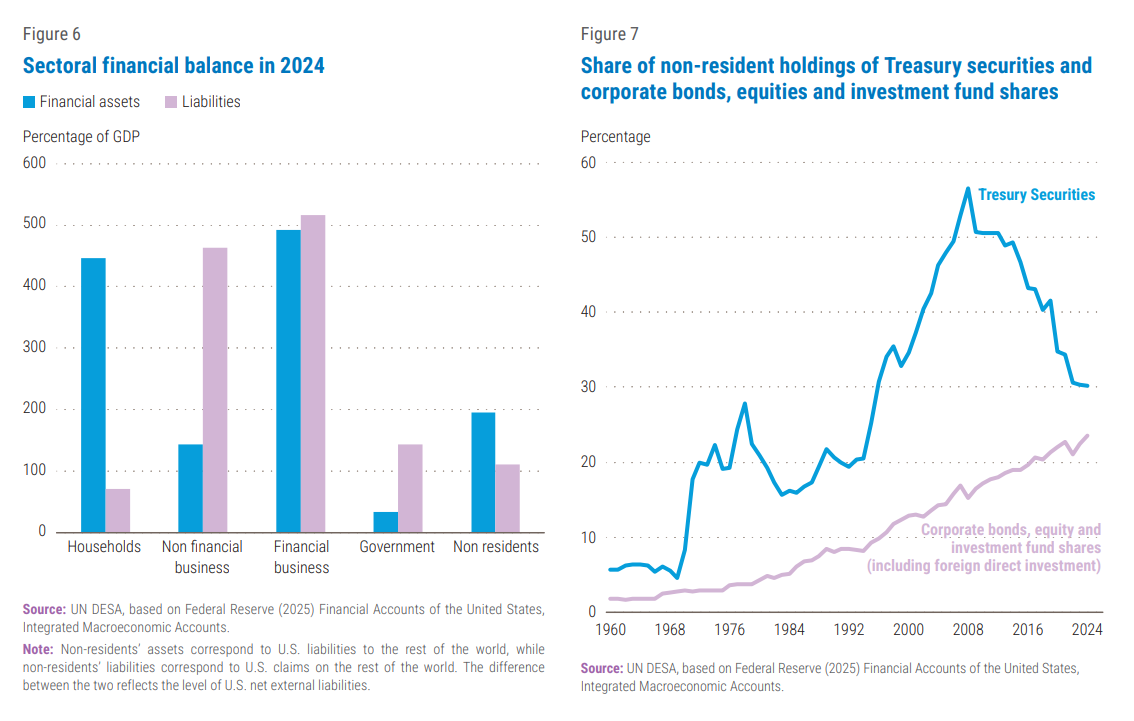
Figure 6 presents the sectoral balance sheet of U.S. financial assets and liabilities in 2024, showing the asset-liability position across different sectors of the economy. The household sector is the main creditor to other domestic sectors, including non-financial businesses, the financial business and the government. For the financial business, the country’s financial intermediaries, assets and liabilities are almost balanced. Total net liabilities of non-financial businesses, the financial business, and the government sector at the end of 2024 amounted to $132 trillion (or 453 per cent of GDP), of which 71 per cent is from the non-financial business sector, 5 per cent is from the financial sector and 24 per cent is from the government sector. For the combined net liabilities of domestic debtor sectors, 82 per cent was held by domestic creditors (household sector’s net assets) and 18 per cent by non-resident creditors (non-residents’ net assets, or external liabilities of the United States).
This balance sheet is analogous to the investment-savings discussion in which trade deficits imply an investment-savings gap. Accumulating investment-savings gaps lead to a widening gap between the net liabilities of the non-financial business sector and the net assets of the household sector. This growing asset-liability imbalance is bridged by net external liabilities, reflecting the cumulative impact of trade balance deficits. In fact, the U.S. investment-savings gap has been gradually widening, with fluctuations, since 1975 and reached 4.4 per cent of GDP in 2024.
Reliance on external financing is increasingly more pronounced in the business sectors than in the government sector. Foreign holdings of U.S. Treasury securities have declined significantly, from a peak of 56.5 per cent in 2007 to 30 per cent in 2024 (figure 7). Over the same period, foreign holdings of corporate bonds, equities, and investment fund shares have grown steadily.
Conclusions
The above observations can be summarized as follows:
First, external liabilities stemming from trade deficits have stabilized since the global financial crisis, as the growth of these deficits has remained broadly in line with GDP growth. This suggests that, while the United States continues to run trade and current accounts deficits, their relative scale has remained steady in recent years.
Second, the recent sharp increase in U.S. external liabilities is largely attributable to valuation effects—particularly the combined impact of a strong U.S. dollar and rising U.S. stock market valuations. These changes do not reflect new borrowing or trade imbalances per se but rather shifts in the market value of existing assets and liabilities.
Third, while the total value of U.S. financial assets has continued to grow in terms of GDP, the composition has shifted. The share of external liabilities—that is, U.S. assets held by non-residents—has increased, whereas the growth of U.S. external assets has stagnated. This asymmetry points to a growing preference among U.S. residents for concentrating their investments in domestic financial assets.
Fourth, while the share of non-residents’ holdings of U.S. financial assets has increased in line with rising U.S. external liabilities, reliance on external financing has become more pronounced in the business sectors than in the government sector, as evidenced by the declining non-residents’ share of Treasury securities.
The recent rise in external liabilities, driven largely by valuation gains in U.S. financial markets, may be mutually beneficial for both U.S. residents and non-resident investors. As long as the valuation gains exist, capital gains, dividend income, and borrowing against appreciated assets can support income growth in both the U.S. and abroad. This dynamic may explain an additional channel that supports the resilience of the U.S. economy of recent past, during recent periods of monetary tightening. However, there is significant uncertainty surrounding the ongoing performance of the U.S. stock market, and over the longer term, this reliance on asset market performance introduces vulnerabilities, exposing the global economy to U.S. stock market adjustments.
While the full impact of recent U.S. trade policy shifts remains uncertain, the structure of the country’s external accounts, both in trade and financial, have been changing over time. Currently, growing net external liabilities, now exceeding the cumulative current account deficits, signal that financial dynamics are increasingly central to the U.S. external position. This calls for greater attention to the financial side of the equation when evaluating the sustainability of the U.S. external balance.
The fact that U.S. dollar interest rates continue to serve as a global baseline—especially for developing economies, where financing is critical for achieving the Sustainable Development Goals—also underscores the importance of close and continuous attention to U.S. external imbalances. As the global economy remains sensitive to shifts in U.S. financial conditions, understanding the evolving structure of U.S. external accounts will be essential for anticipating global economic vulnerabilities.
 Welcome to the United Nations
